The Octofleet family just got bigger! While our Windows agent has been monitoring fleets across the globe, Linux servers were feeling left out. Not anymore. Today we’re releasing the Octofleet Linux Agent v0.5.0 — a lightweight, pure-bash agent that brings full visibility to your penguin-powered infrastructure.
What’s New?
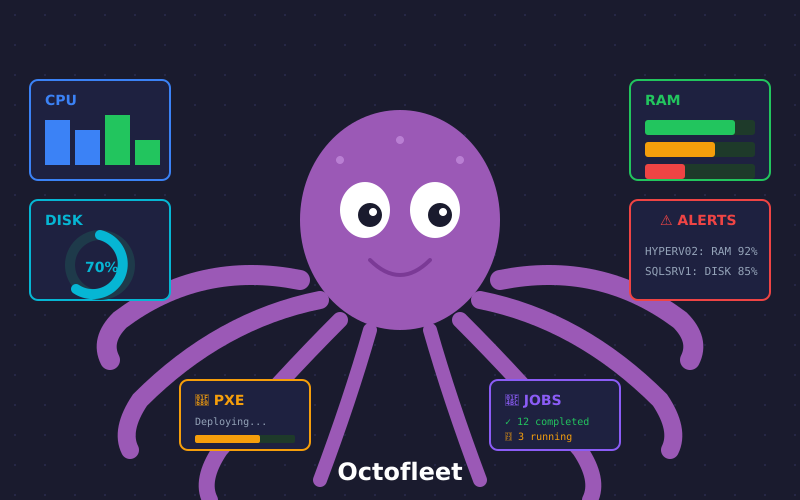
The Linux agent now collects everything you need to monitor your servers effectively:
📊 Performance Monitoring
Real-time visibility into your system’s health:
- Load Average — 1, 5, and 15 minute averages
- CPU per Core — Individual usage percentages for all cores
- Memory Details — Total, available, buffers, cached, and swap
- Disk I/O — Reads, writes, and throughput per device
- Network I/O — RX/TX bytes and packets per interface
⚙️ Service Monitoring
Complete systemd integration:
- List all services with their current state
- Track active, failed, and inactive services
- Quick identification of problematic units
- Service count summary at a glance
📦 Package Updates
Stay on top of your patches:
- Detects available updates from apt, dnf, yum, or pacman
- Counts security-critical updates separately
- No
apt-get updateduring collection (uses cached data for speed) - Perfect for compliance dashboards
🩺 Disk Health (SMART)
Proactive hardware monitoring:
- SMART status for all drives (requires
smartctl) - Temperature readings
- Power-on hours tracking
- Health status badges (PASSED/FAILED)
Installation
Getting started is simple:
# Quick install
curl -sSL https://raw.githubusercontent.com/BenediktSchackenberg/octofleet/main/linux-agent/install.sh | sudo bash

# Or clone and run manually
git clone https://github.com/BenediktSchackenberg/octofleet.git
cd octofleet/linux-agent
sudo ./install.sh
Configure your agent:
# /opt/openclaw-agent/config.env
API_URL=http://your-octofleet-server:8080
API_KEY=your-api-key
NODE_ID=$(hostname)
POLL_INTERVAL=60
The Dashboard Experience
Once your Linux nodes start reporting, you’ll see a new 🐧 Linux tab on each node’s detail page:
CPU Cores Heatmap — Visualize per-core utilization with color-coded badges. Green is chill, yellow is busy, red is sweating.
Services Overview — Instant summary showing active vs failed services. Click through to see the full list with descriptions.
Disk Space Bars — Progress bars showing usage per mount point. Watch those /var/log partitions!
Package Updates Table — See exactly which packages need attention, with version numbers.
Technical Details
The agent is 100% pure bash — no Python, no Ruby, no dependencies beyond standard Unix tools. It runs as a systemd service and pushes inventory every 60 seconds (configurable).
Supported distros:
- Debian / Ubuntu
- RHEL / CentOS / Rocky / Alma
- Arch Linux
- Any systemd-based distro
Resource footprint:
- ~2MB on disk
- Minimal CPU usage during collection
- Network: ~50KB per inventory push
What’s Next?
The Linux agent is just getting started. On the roadmap:
- 🔐 Security scanning — SELinux/AppArmor status, open ports, failed logins
- 📈 Historical metrics — TimescaleDB integration for trend analysis
- 🚨 Alerting — Threshold-based notifications for disk, memory, services
- 🔄 Remote commands — Execute bash scripts from the dashboard
Get Started
Octofleet is 100% open source and self-hosted. Your data stays on your infrastructure.
Questions? Feature requests? Open an issue or join the discussion!
Happy monitoring! 🐙🐧