When your endpoint management platform hits 500+ API endpoints, 30 backend routers, and a sidebar that scrolls off-screen — you have a navigation problem. This is the story of how we tore apart Octofleet’s entire information architecture and rebuilt it around the way sysadmins actually work.
The Problem
Here’s what happened organically over the past few months: we kept shipping features. Security monitoring, patch orchestration, compliance baselines, vulnerability tracking, remediation engines, a query engine, content lifecycle management, software metering. Every new epic got its own sidebar entry. The sidebar grew. And grew. And eventually it looked like a phone book.
The real issue wasn’t the feature count — it was that navigation was organized by feature category, not by workflow. A sysadmin who wants to check if their fleet is patched and compliant had to jump between 4 different sidebar groups. That’s not usable, that’s a scavenger hunt.
The New Information Architecture
We restructured the entire navigation around six task-oriented groups:
| Group | Purpose |
|---|---|
| Fleet | Everything about your devices — nodes, groups, hardware inventory, discovered systems |
| Deploy | Software lifecycle — packages, repositories, deployments, jobs, software comparison, metering |
| Secure | The full security stack — findings, events, monitoring profiles, behavior rules, policies, vulns, remediation, compliance, posture, file audit, evidence, retention |
| Operate | Day-to-day ops — patches, performance, alerts, event logs, reports, query engine |
| Provision | Infrastructure — PXE provisioning, content lifecycle, SQL management, service orchestration |
| Admin | System management — users, audit, API keys, agent monitoring, settings |
The labels are verbs, not nouns. “Fleet” instead of “Devices”. “Deploy” instead of “Software”. “Secure” instead of “Security Center”. It sounds minor, but it changes how your brain maps the navigation. You think “I need to secure something” → click Secure. Done.
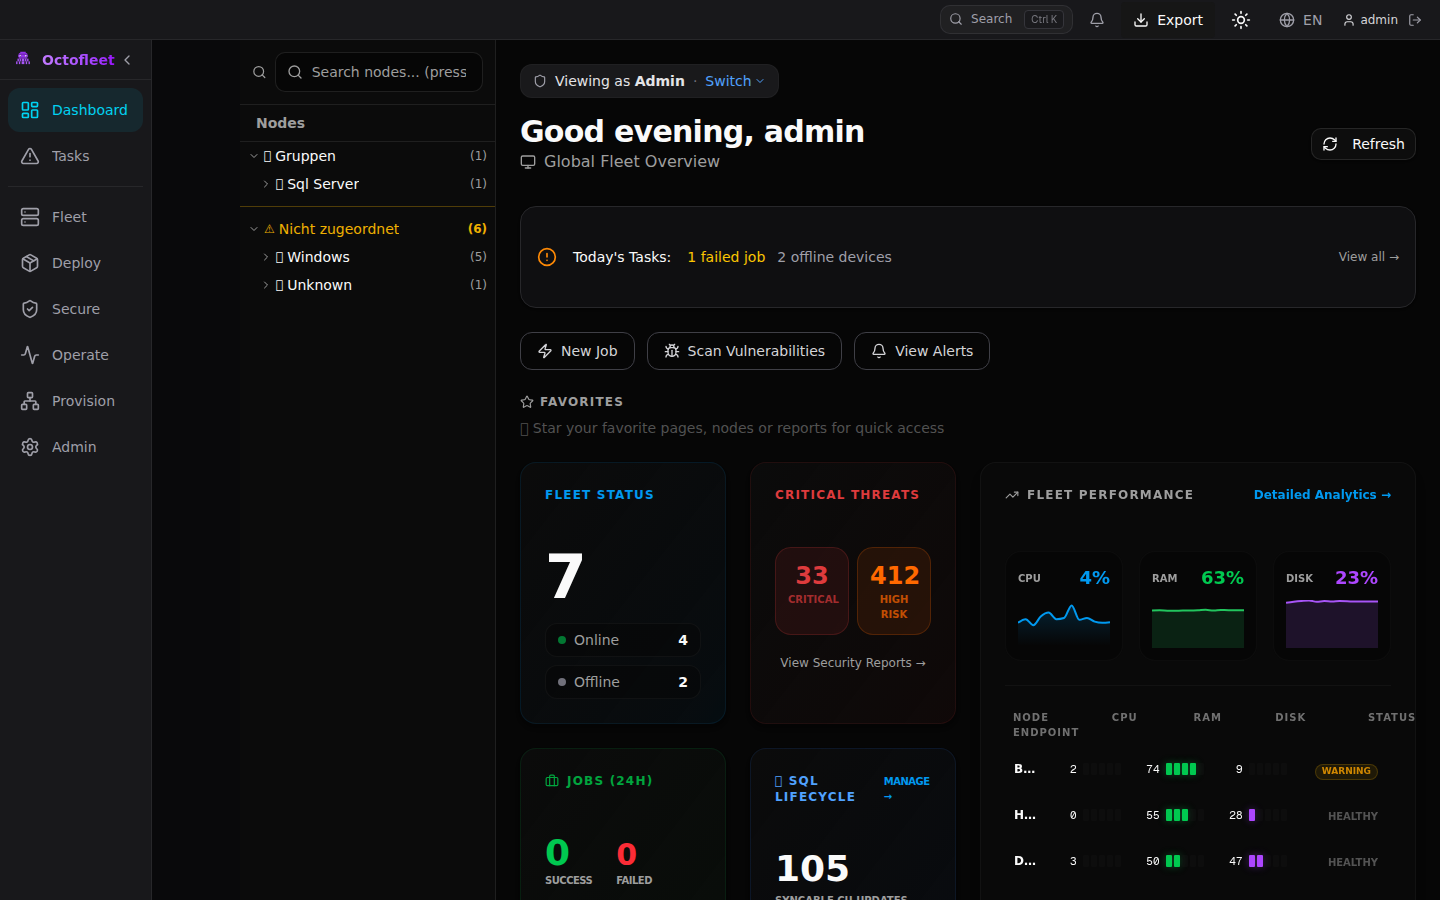 The redesigned dashboard with the new sidebar navigation. Notice the task-oriented group labels and the role-based greeting.
Role-Based Dashboards
Not every user needs the same dashboard. An admin cares about system health, storage, and pending approvals. An operator cares about failed jobs and offline nodes. An auditor cares about compliance posture and the audit log.
We built a role-detection layer that wraps the dashboard content:
<RoleDashboard role={getRole()}>
  {/* admin sees the full bento grid */}
  {/* operator sees focused ops view */}
  {/* auditor sees compliance summary */}
</RoleDashboard>
Each role gets a tailored view with relevant stat cards, quick actions, and activity feeds. There’s a “Switch View” dropdown in the role banner for users who want to peek at other perspectives — because sometimes an admin wants the operator’s focused view when they’re in firefighting mode.
The implementation uses a DashboardWidgets module with four reusable primitives:
- StatCard — Icon + label + value + trend indicator (up/down/neutral with color coding)
- QuickActionCard — Clickable action card for common workflows
- ActivityFeed — Timestamped list with icons, links, and relative time formatting
- ComplianceGauge — Bar-style progress indicator with threshold-based color coding
These compose into role-specific layouts without duplicating any presentation logic.
Live Navigation Badges
Static sidebars are blind sidebars. You shouldn’t have to click into the Security section to discover you have 33 critical findings. The information should come to you.
We added a useNavBadges hook that polls five API endpoints every 60 seconds:
export function useNavBadges(): NavBadges {
  // Polls: findings, vulnerability summary, failed jobs, alerts
  // Returns counts, gracefully handles 404/500 (returns 0)
  // Cleanup on unmount, no memory leaks
}
The sidebar now shows small badge pills next to group headers and individual items. Red pills for critical items (security findings), amber for warnings (unpatched devices). The badges only render when count > 0 and disappear when the sidebar is collapsed — because cramming a number into a 48px collapsed bar is not helpful, it’s noise.
 The Security & Compliance overview showing 397,644 normalized events in the last 24 hours across 7 nodes. The sidebar shows the expanded Secure group with all sub-pages.
Enhanced Command Palette
Ctrl+K already opened a command palette with three modes: jump (default), actions (>), and knowledge (?). We extended it significantly:
New action commands:
- Open Remote Shell
- Create Configuration Baseline
- Create Patch Ring
- Export Compliance Report
- Trigger Remediation
- Review Pending Approvals
Pinned quick-access items in knowledge mode:
- Critical Nodes (nodes with findings or offline)
- Failed Jobs
- Unpatched Devices
- Recent Alerts (24h)
The palette searches across all navigation targets, registered nodes (with live status indicators), action commands, favorites, and recently opened pages. It’s essentially a keyboard-driven control center for the entire platform.
Empty States That Actually Help
Nothing is worse than landing on an empty page with zero guidance. Our EmptyState component got a complete overhaul — from a sad 14-line “nothing here” message to a full onboarding system:
Context-specific empty states via GuidedEmptyState:
- Empty nodes page → “Connect your first device using the agent installer” with a direct link to the onboarding config
- Empty jobs page → Explains that jobs are created through deployments, scripts, and remediation
- Empty patches page → “Create your first patch ring to start managing Windows updates”
First-run checklist via FirstRunChecklist:
- ✅ Create admin account (auto-checked — they’re logged in)
- Connect your first device →
/nodes - Create device groups →
/groups - Set up patch rings →
/patches - Enable security monitoring →
/security/profiles - Configure alerting →
/alerts
Each step checks completion via API calls. The checklist persists dismissal in localStorage and won’t bother you once you’ve set everything up.
Saved Views & Bulk Workflows
Every list page in Octofleet now supports saved views. Filter your nodes by OS, sort by last seen, select specific columns — then save that configuration as “Windows Servers (Offline)” and load it with one click next time.
const { views, currentView, saveView, deleteView } = useSavedViews("nodes");
The SavedViewBar renders as a horizontal pill bar above list content. Views are stored in localStorage per page. You can set a default view that auto-loads when you visit the page.
For bulk operations, we built BulkActionBar — a floating bottom bar that slides up when you select multiple items in any list. Select 15 nodes, hit “Move to Group” or “Create Job” or “Remove” without navigating away. The useBulkSelection hook manages a Set<string> of selected IDs with toggle, selectAll, and clearAll operations.
Feedback & Transparency
Every destructive action now gets an undo window. Delete a patch ring? A toast appears with “Undo” for 5 seconds. The ActionToast system wraps Sonner with undo callback support:
showActionToast("Ring deleted", {
  type: "success",
  undoFn: () => restoreRing(ringId),
  undoTimeoutMs: 5000
});
Disabled buttons now explain why they’re disabled. The PermissionHint component shows a lock icon with “Requires admin permission” instead of leaving users guessing. It uses the existing RBAC system (getRole(), hasPermission()) to generate contextual explanations.
The useActionFeedback hook wraps async operations with status tracking (idle → running → success → failed), auto-generates toast notifications, and handles error display — all without the page component needing to manage loading states manually.
Under the Hood: The Fleet at Scale
Here’s what the Octofleet test fleet looks like right now:
 7 nodes reporting in: 5 Windows Server 2025, 1 Windows 11, 1 Linux. All running Agent v0.7.0. The grid view with live status indicators.
 24 patches in the catalog, 80 pending approval, ring-based deployment strategy with approve/exclude actions per KB.
The security monitoring stack is processing serious volume — 397k+ normalized events and nearly 10k file audit events in a 24-hour window across 7 nodes. That’s network connections, process lifecycle, service changes, logon events, and registry modifications all flowing through the agent sensor pipeline into TimescaleDB with automatic hourly rollup aggregation.
Technical Details
The frontend is Next.js 16 with TypeScript (strict mode, zero build errors), Tailwind CSS with a zinc-900 dark theme, shadcn/ui components, and Recharts for data visualization. The sidebar uses a two-tier layout: collapsed mode shows only group icons (48px), expanded mode shows the full hierarchy with sub-items.
All API calls go through a centralized apiClient — no raw fetch() anywhere in the codebase. Auth tokens are injected automatically. Error handling produces user-friendly toast notifications. The hook layer (useNavBadges, useSavedViews, useBulkSelection, useFavorites, useRecentlyOpened) keeps component logic clean and reusable.
Backend sits at 509 endpoints across 30 router modules in FastAPI, backed by PostgreSQL 16 with TimescaleDB for time-series event data. The .NET 8 agent runs 8 security sensors (process, network, registry, logon, service, file audit, health, patch scanner) and reports on a configurable interval.
What’s Next
The UX overhaul was the last piece before we start tackling the remaining enterprise features:
- E35: Enterprise Reporting Suite — scheduled PDF/CSV reports with custom templates
- E36: RBAC Delegation — granular permission delegation and scope-based access
- E32: Smart Proxy — edge proxy for remote/disconnected site management
- E37: Cloud Attach — Azure/Intune co-management bridge
The foundation is solid. 509 endpoints. 30 routers. 41 E2E tests. Dark mode everywhere. A sidebar that doesn’t need scrolling anymore. Time to build on top of it.
Octofleet is open source at github.com/BenediktSchackenberg/octofleet. Star it if you’re into endpoint management that doesn’t cost a kidney. 🐙